Motor Vehicle Accidents Analytics
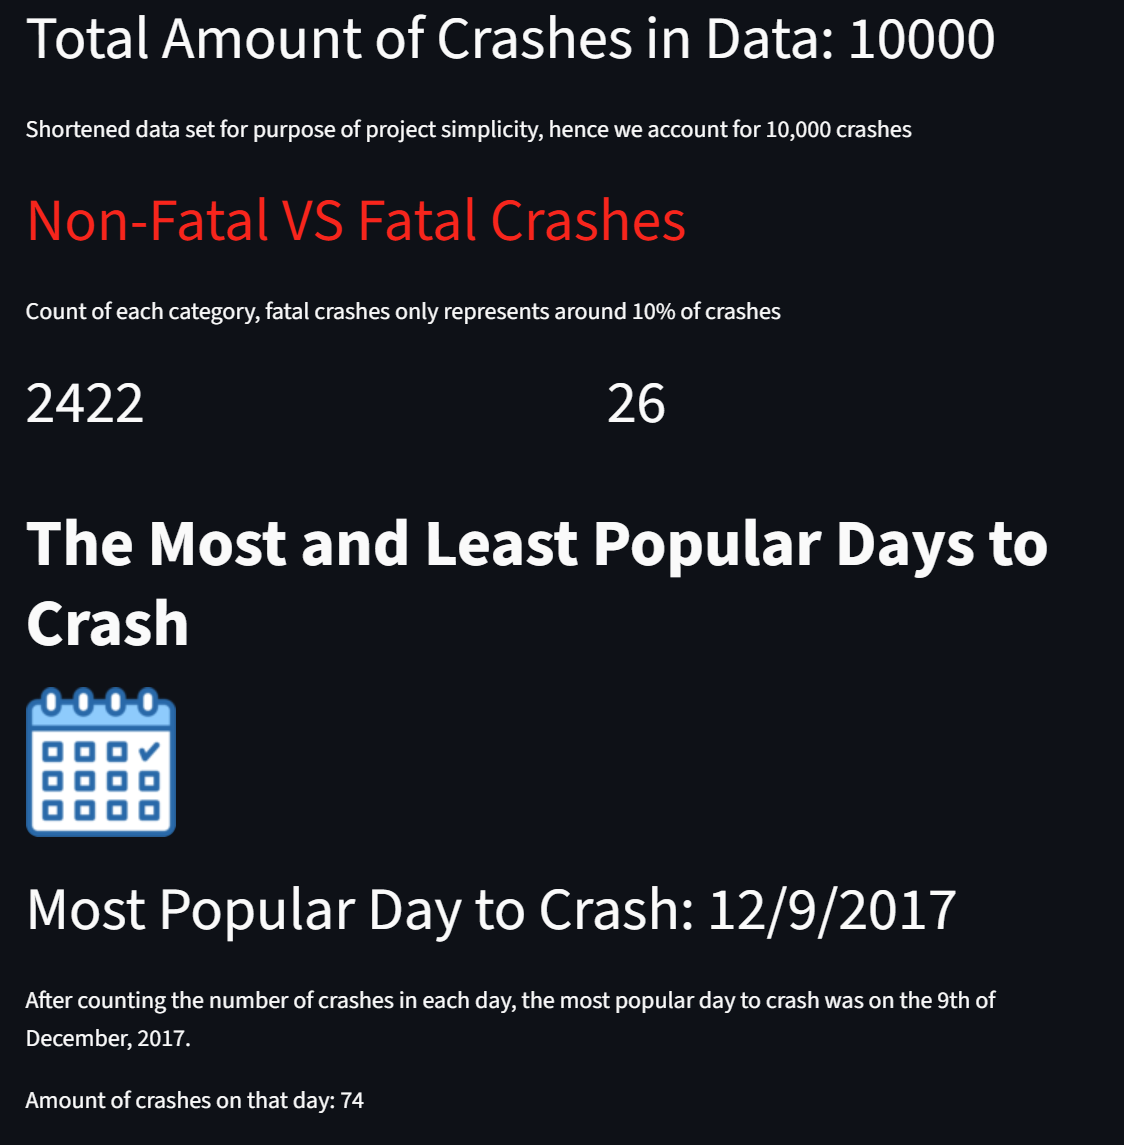
This project focuses on creating an engaging and intuitive user interface that matches the theme of the crash data. The main page introduces and explains key variables, highlighting the most and least popular crash cities with icons and summaries. The data dictionary uses a Python dictionary to display the raw data in a table for users to explore and better understand their variables. The descriptive stats tab shows key dataset insights, while the weather tab reacts to user input—generating visualizations based on fatality, accident type, and a pie chart for chosen variables. For time analysis, I parsed and grouped days by month to create a histogram with color intensity showing crash volume. Users can also search by date. In the location tab, users choose from four columns (like city or street) to generate a pie chart comparing crashes across locations. The map section includes a folium map with clustered crash labels (darker = more crashes) and a Plotly map grouped by road condition.
Access the app here!